I don’t believe they’ve added anything to customize the builtin charts…
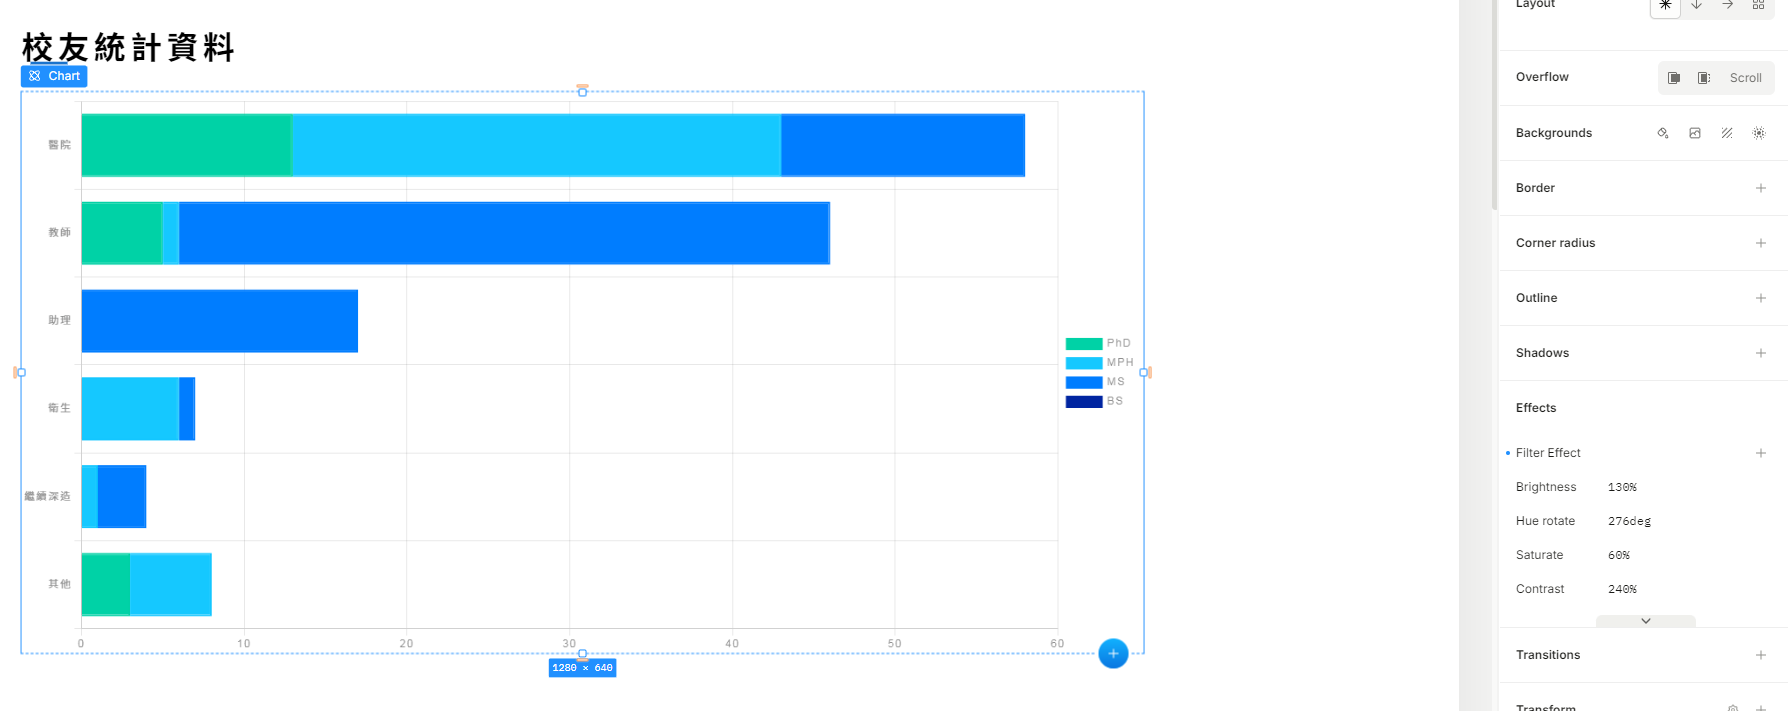
However, you could add some “Filter Effects”/custom CSS to adjust them (with ok results) ![]()
- Example:
- Live website: Alumni Stories
Alternatively, you could add a code component with more customizable flexibility!
- Example: I recently added a custom radar chart via the
chartjs+react-chartjs-2packages: Beginner trouble getting Code Component chart to display content - #4 by leafer_design